6. Output

Output and Factor Visualizations FAQ:
Do the Excel and CSV output files have the same content? -Yes.
On the composite factor visualizations, what do the asterisks represent? -The asterisks indicate distinguishing statements. A single asterisk indicates that the statement is distinguishing at
P < .05. Two asterisks indicate that the statement is distinguishing at P < .01.On the composite factor visualizations, what are those black triangles? -A black triangle pointing to the right indicates that the statement is ranked higher in that factor than in other factors. A triangle pointing to the left indicates that the statement is ranked lower in that factor than in other factors.
Can I remove the asterisks and black triangles? -Yes, open the Factor Visualizations Display Options panel and change the default options.
Can I create an empty sort grid? -Yes, see the guide below.
Can I display just the statement numbers on the grid? -Yes, see the guide below
Can I output high-resolution images of the composite factor visualizations?
-Not directly in Ken-Q, but you can create a high-resolution image by first downloading an SVG image from Ken-Q and then using software like Inkscape to transform that SVG image into a high-resolution PNG file (or other format file).Can I also show consensus statements on the grids?
-Yes, see the guide below.
[ add overview video here ]
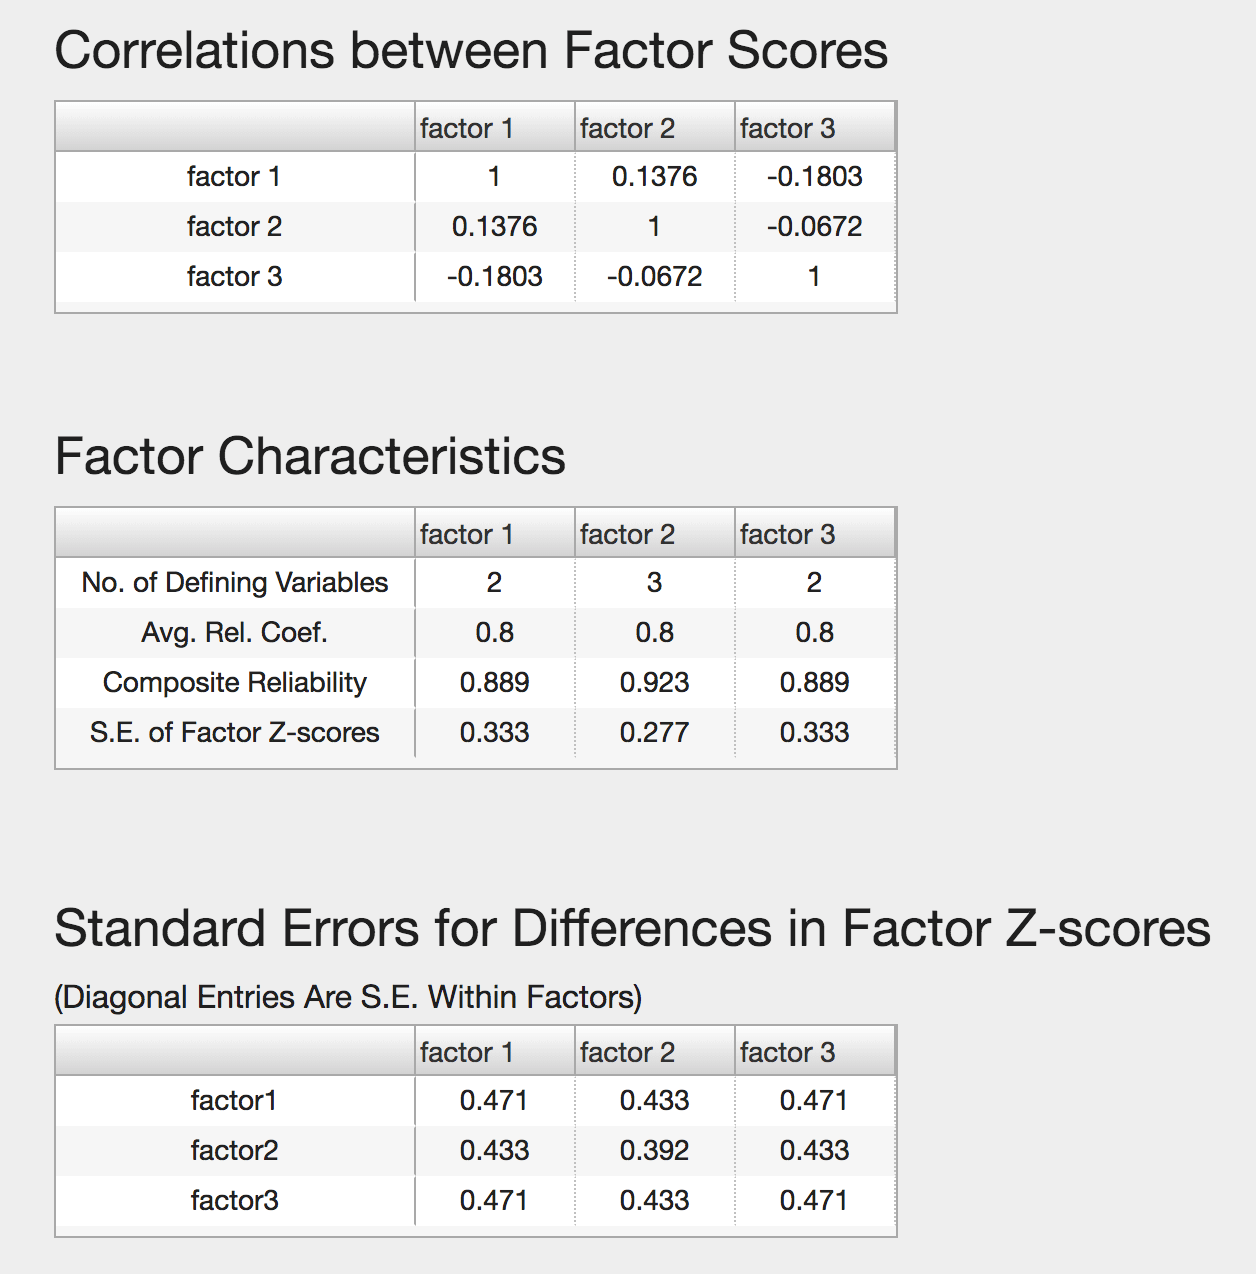
Output Tables